This program is a client-server based finance application that allows for querying and searching in realtime for Stock Prices utilizing the yfinance REST API which pulls a request for respective prices at the time of trading. The purpose for this project was to create a client and server application that simulates a stock market, where the client is used to request specific 'tickers' (ie, stock symbols for each company being traded) and the server in response sends back the current stock price per the time the request was made. This program was written in Python with the intent to learn how to use sockets, fine tune my understanding of the OSI Model and explore how each layer works within a software application. In no manner though is this intended for actual trading, it was simply built as a creative outlet to learn more about networking and how to use sockets in Python with a client-server architecture as the framework.
- To run the server, execute the following command in your terminal:
'python server.py'
- Then, to run the client, you will need to open a separate terminal window or execute the program by double-clicking the stock_dashboard_client.py file:
'streamlit run stock_dashboard_client.py'
- Once this has been initiated, a prompt will open showcasing a request that can be made to the server for a stock of interest. This will open the default web browser of your choice from your machine and then display the GUI made within streamlit, which currently has a dropdown menu to showcase some of the most popular stocks within the technology sector with a visual chart that if utilized overtime would show any trends in the stock prices that you've queried or that are of interest to you.
Feel free to try it yourself!
- I've opted to have the data requested from the server to be stored in a local csv file, which serves two purposes:
-
It ensures that the server and the client are actually working, and that no packets were lost in the request, which is compliant with the TCP Protocol.
-
This also serves as a way to track, analyze, and explore actively collected data for future trend predictions. This can be used within the pandas library and further explored locally through plugins such as SQL-Lite providing a robust set of tools for data exploration of the stock prices of interest.
Software Video Walkthrough via YouTube
I used the TCP protocol for this program, as I didn't want packets to be lost during the request and response window. I used port 65432 for the server (which as my research indicated is the default port for Python sockets), with the addition of using the HOST IP address of '127.0.0.1' (which is used for the server to listen for requests from the client). In this case, I've only created this program to run locally, so at this time of writing the client and server run on the same machine, however, a future enhancement for this program would be to scale it so that the server is accessible via a Cloud Service with the addition of allowing multiple clients to connect to the server at the same time without request issues/collisions.
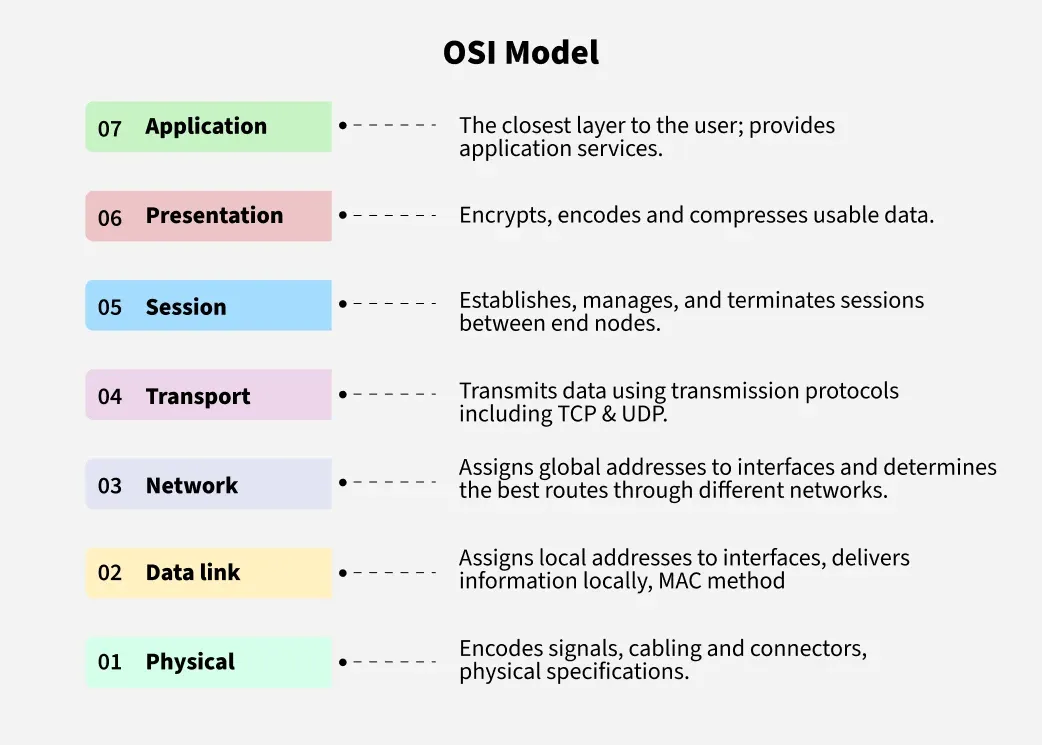
This visual of the OSI Model was provided from GeeksforGeeks, which as known within the industry is a great resource for learning new concepts and understanding how to best apply them.
The OSI Model in practice for my program:
- Application Layer:
- Streamlit app runs on the client side, providing a GUI for a user with the implemented dropdown menu and chart to visualize stock prices.
- Presentation Layer:
- This is where data that is retrieved from the server is formatted from a packet into a readable format, which for us means that it is converted from a JSON response (ie, encoded data) into a format that is parsed and then displayed in streamlit and within the csv file.
- Session Layer:
- Using the socket library, it manages our connection, which as shown within my script allows for 'connect, accept, send, and recv' to all work in an interconnected state once the connection is established between the server and client.
- Transport Layer:
- TCP makes it so that no data is lost in the transmission of data, for the socket library, this is handled by the socket library using SOCK_STREAM.
- Network Layer:
- Our IP protocol (ie, 127.0.0.1) routes the data exchanged between the local machine (as the server and client are locally ran).
- Data Link Layer:
- I have a wifi card on my machine, it sends the frames (data is sent).
- Physical Layer:
- This isn't present as I am not physically connected to any other devices.
This program was written in Python, using the folllowing libraries:
yfinance- retrieves stock data from Yahoo Finance REST APIsocket- python library for network communication with the serverrequests- enables HTTP requestsschedule- for scheduling tasks (ie, retrieving stock data at scheduled intervals)pandas- used for data analysis, visualization, and cleansing as seen appropriate for the created csv file.streamlit- this is a web GUI library that enables locally hosted webpages to be made and simulated with a ample set of tools for customizing a landing page, which is what I used it for!
- Post Man
- Y-Finance ~ Polygon
- Python Requests
- Socket Documentation ~ Python
- Schedule Documentation ~ Python
- Web Site Name
-
It would be ideal to add a search bar to the Streamlit app to search for any ticker symbol / stock, and in order to do this I could add a basic webframe layout by either columning this into two sections so that the current static list for tech stocks is maintained as a way to showcase an example of how this could be used, which overall would make the front-end side of things extremelly easy to use and navigate as right now its limited to just a dropdown menu.
-
An addition that would also be useful for this application is to add threads to the server application, this would allow for multiple clients to connect and make requests at the same time for stock prices; in conjunction with the schedule library, it would be incredibly efficient to have a daily update of stock prices, which could be automated and then stored in a csv file for reviewing long-term trends. This isn't currently implemented but would be a fantastic feature to add in the future.
-
Wireshark could be considered to analyze the network traffic between the server and client, which would be a real-time view of packets being sent and received, it would an excellent asset to analyze the performance and efficiency of the network itself.