Install mycli with dataframe support using:
pip install --upgrade 'mycli[dataframe]'or install these libraries separately:
Dataframe transforms and plots are new and experimental. The interface and functionality may still change.
Here are some known limitations:
- transforms can't be composed with
$|shell redirection - composing multiple transform operations is not supported
- results from
UNIONs may be unable to be transformed
And there are inherent limitations to the post-processing model: the entire SQL result must be transferred from the server and loaded into local memory.
In the interactive REPL, append the .| operator and a Python expression to a
single SQL statement. The Python expression receives
df, a PolarsDataFramepl, the Polars modulealt, the Altair module
Spaces may be required around the .| operator.
Transform example:
SELECT * FROM orders .| df.group_by('customer_id').len();which is equivalent to this native SQL:
SELECT customer_id, COUNT(1) AS len FROM orders GROUP BY customer_id;Transform expressions run with normal Python privileges, and expressions should not be run from untrusted sources.
If the transform operation returns a Polars DataFrame or Series, or a
Python type which can be rendered as a table, the result is rendered by mycli
as tabular output. None return values will be silently ignored, and other
return types will result in a warning message.
Transform expressions are useful for operations such as medians which cannot be done (or are awkward) in SQL. Example:
SELECT * FROM orders .| df.describe();If the dataframe transform operation returns an Altair plot, the result can be rendered as an inline PNG in many terminals.
Example:
SELECT * FROM orders .| df['total'].plot.hist();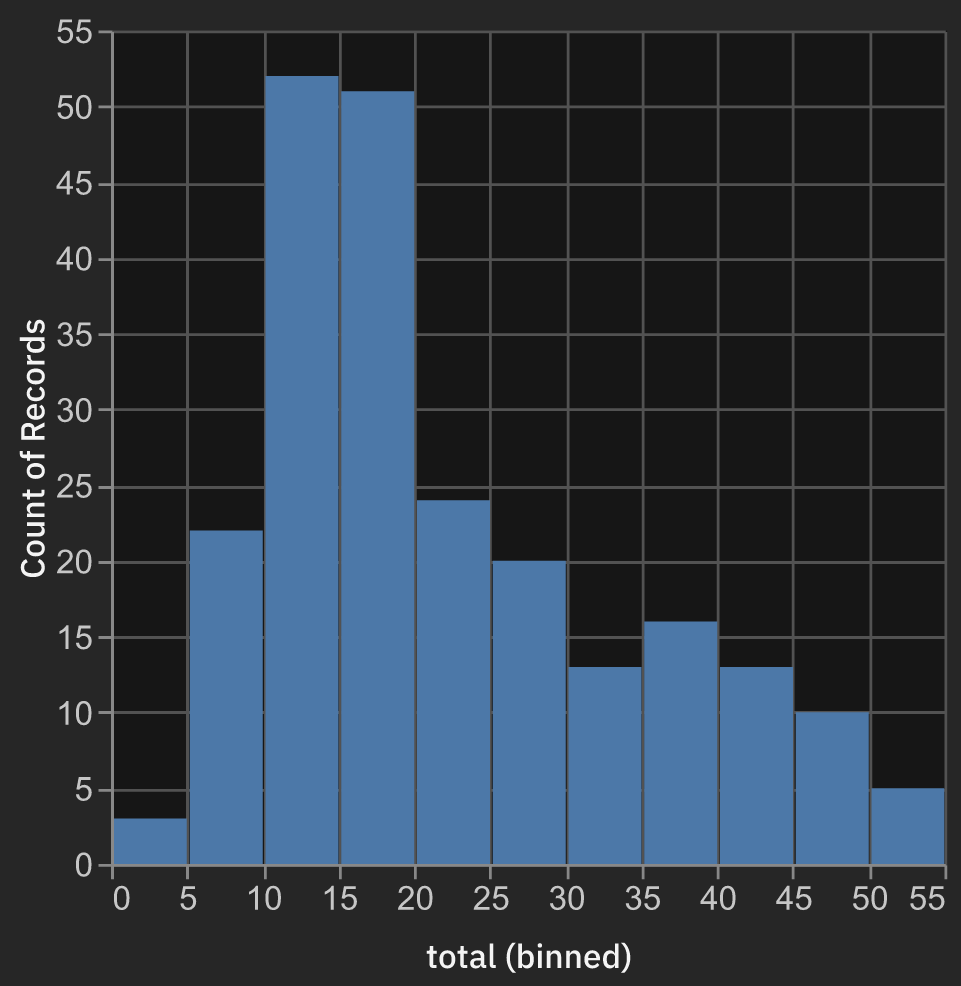
Image size, display protocol, and other properties can be configured in
the [dataframe] section of ~/.myclirc.
A query result, transformed DataFrame, or transformed Series can be
written directly to a Parquet file with the .> operator. An Altair plot can
also be written to a file with the same operator.
Save example:
SELECT * FROM orders .> orders.parquet;The .> operator must be last, requires a .parquet, .png, .pdf, .svg,
or .html file extension on the destination, and overwrites any existing file.
Spaces may be required around the operator. Destination paths containing whitespace must be quoted. A successful write reports its destination and row count if appropriate.
When saving a plot, the format is deduced from the file extension.
When post_redirect_command is set in ~/.myclirc, the given command runs
after a successful file save.
.> cannot be combined with the \x or \G special display terminators.
Parquet saves may be combined with dataframe transforms. Again, the save
operator .> must be the last operator.
Combined transform and save examples:
SELECT * FROM orders .| df.group_by('customer_id').len() .> customer_counts.parquet;SELECT * FROM orders .| df['order_id'] .> order_ids.parquet;SELECT * FROM orders .| df['total'].plot.hist() .> total_histogram.png;